Webhook History
Browse and live-tail inbound requests and outbound delivery attempts
Every connection has a History tab on its detail page. Two subtabs - Inbound and Outbound - show the last 30 days of traffic, updated live as new events land.
Browsing Inbound Requests
The Inbound subtab lists every POST that landed at /webhooks/in/{connectionId} - success, failure, and everything in between.
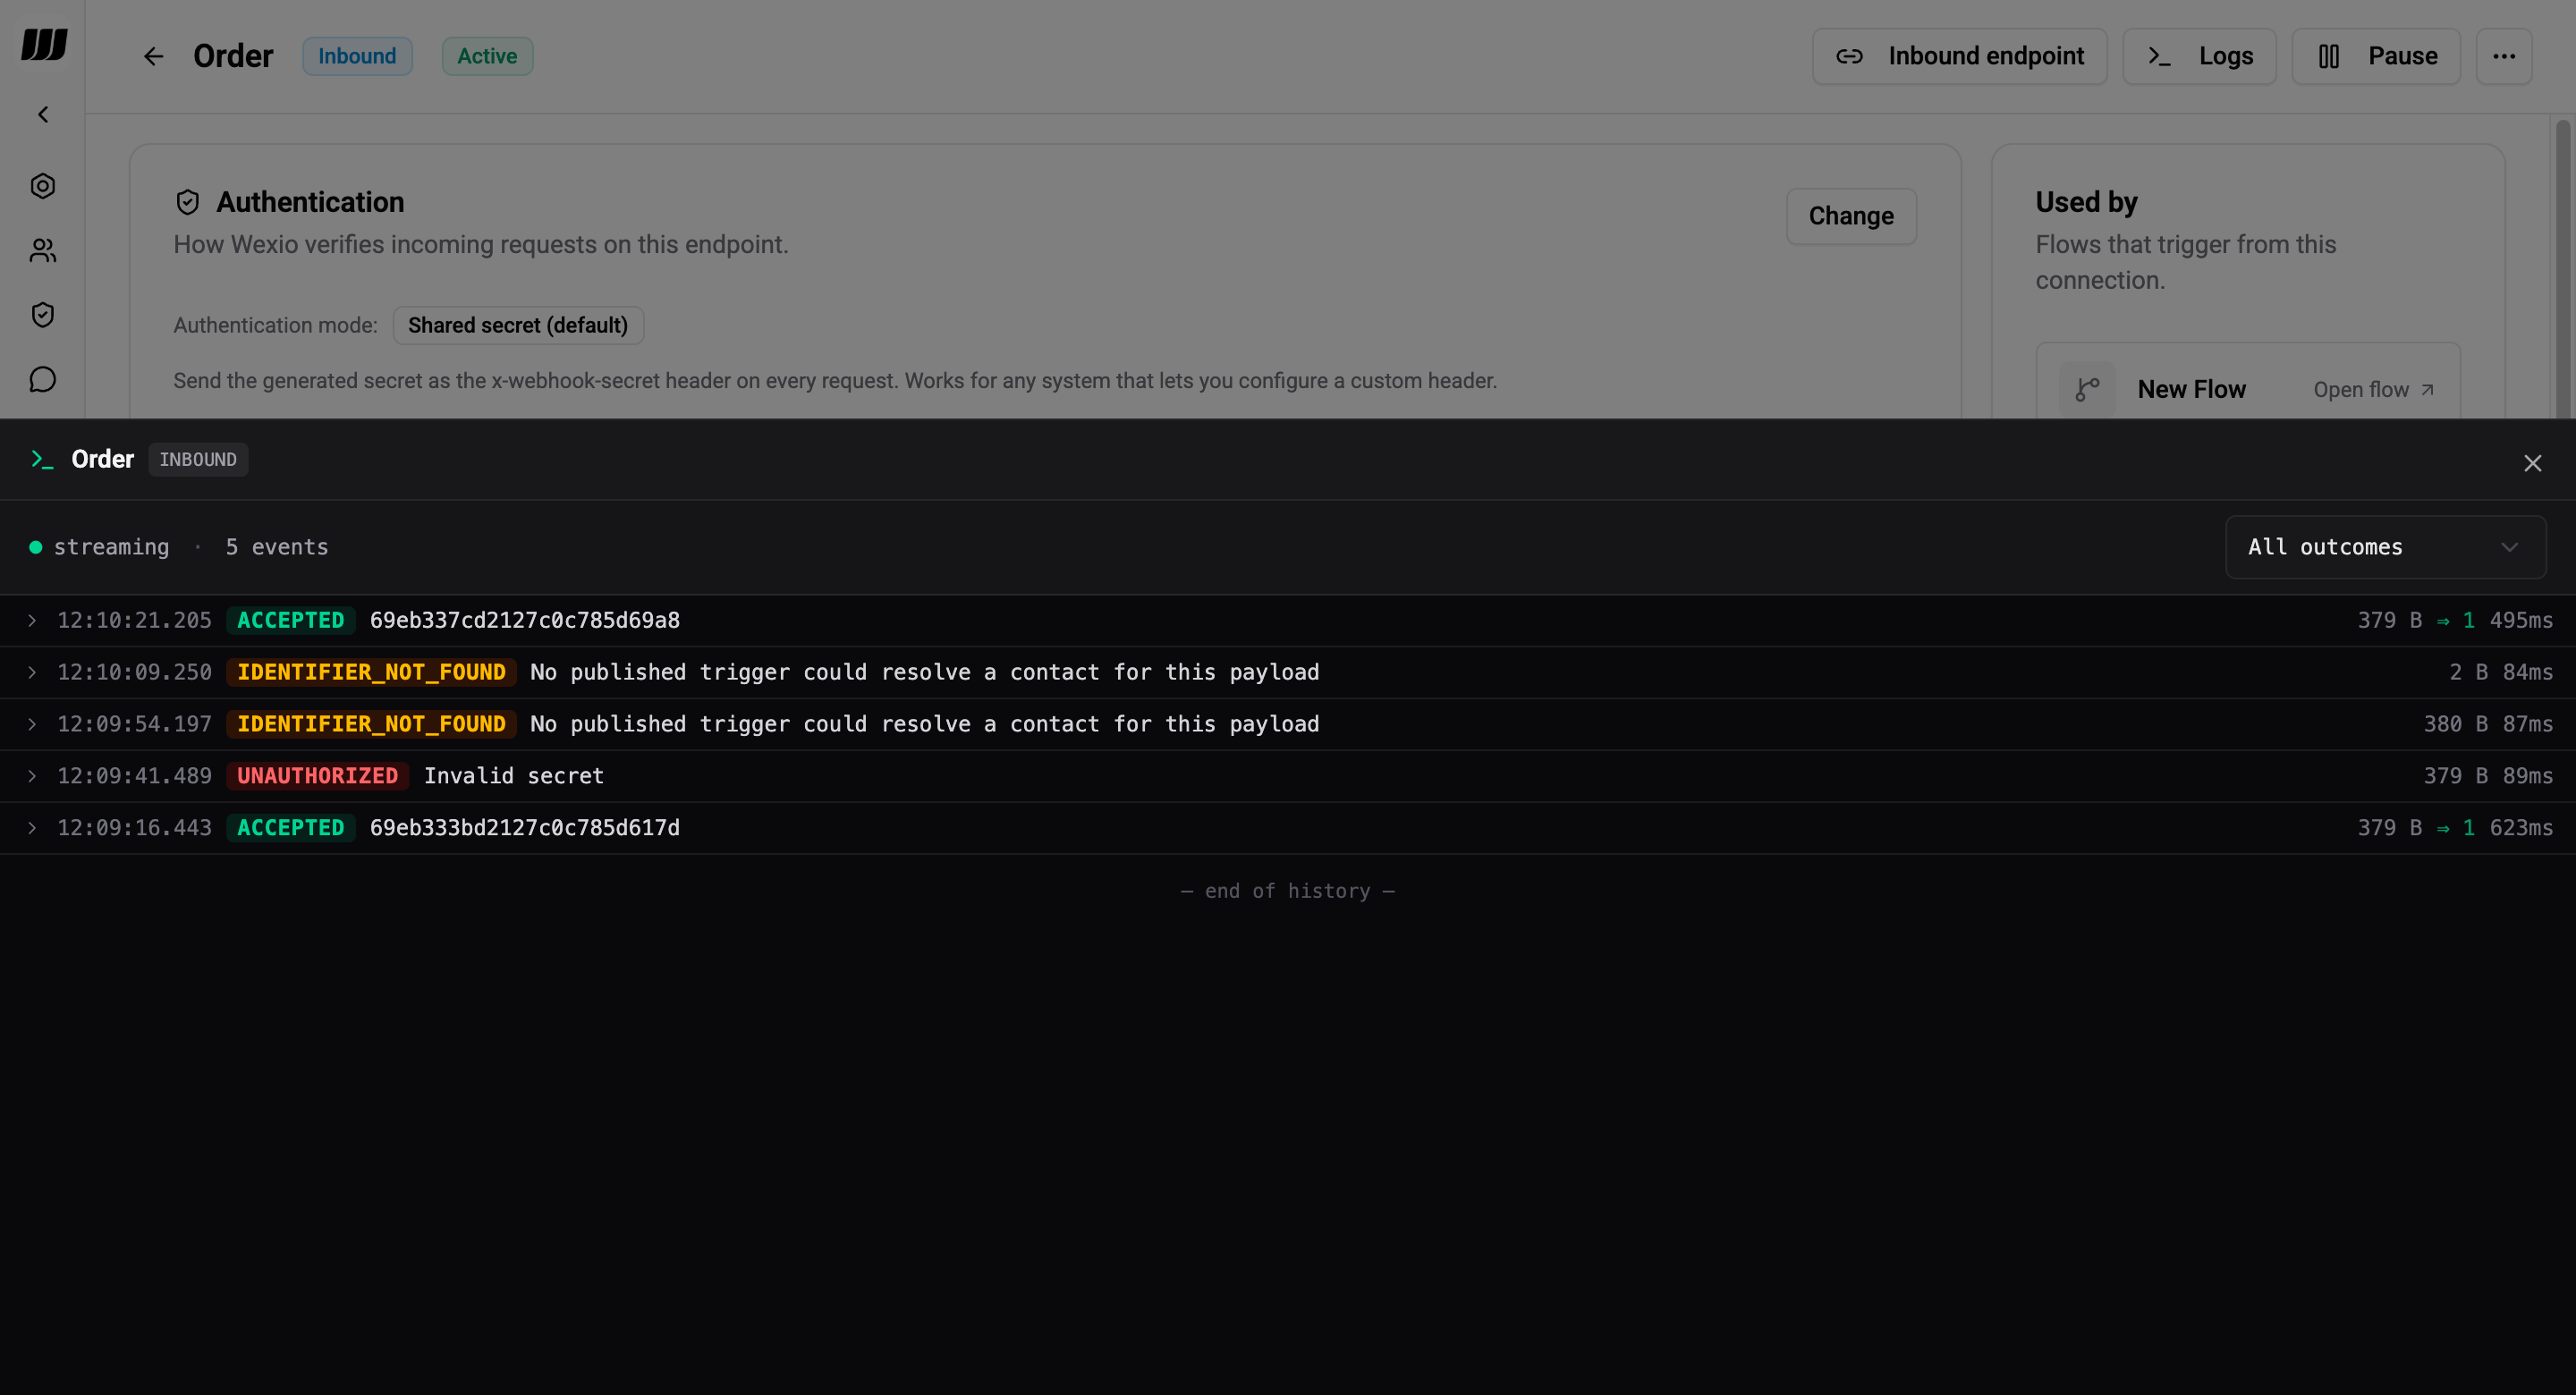
Each row shows:
| Column | Meaning |
|---|---|
| Timestamp | When the request was received |
| Outcome | Terminal state - coloured pill |
| Request ID | Short ID (usually from the x-request-id header) for correlation |
| Body size → attempts | Size of the body that arrived, and how many flow executions were planned |
| Duration | End-to-end processing time |
Outcome pills
| Pill | Meaning |
|---|---|
ACCEPTED | Authenticated, parsed, at least one flow started |
SAMPLE_CAPTURED | Absorbed by an open capture tunnel - no flow ran |
UNAUTHORIZED | Signature / secret mismatch - expand the row for the message detail |
INVALID_JSON | Body was not valid JSON |
PAYLOAD_TOO_LARGE | Body exceeded 100 KB |
IDENTIFIER_NOT_FOUND | No contact resolved from the payload |
TRIGGER_NOT_FOUND | Connection paused / missing / no trigger bound |
ERROR | Unclassified failure |
Expand any row to see:
message- human-readable reason (e.g. "Invalid secret", "Stripe signature timestamp outside ±5 min tolerance", "No published trigger could resolve a contact for this payload")headers- the whitelisted subset of request headers that are safe to log (see Redaction)bodyPreview- first 4 KB of the body (truncation marker if longer)resolvedPeopleId- contact resolved from the payload, when applicable
Filter and search
Filter by outcome with the dropdown (e.g. "show me only UNAUTHORIZED") to diagnose auth issues quickly. The subscription channel does not filter - if a filter is active, scroll produces filtered-only rows but live-incoming rows still append to the top until you refresh.
Live tail
The stream indicator (• streaming) in the top-left of the panel shows the live subscription status. New rows appear at the top of the list as they're received; already-shown rows are deduped by ID.
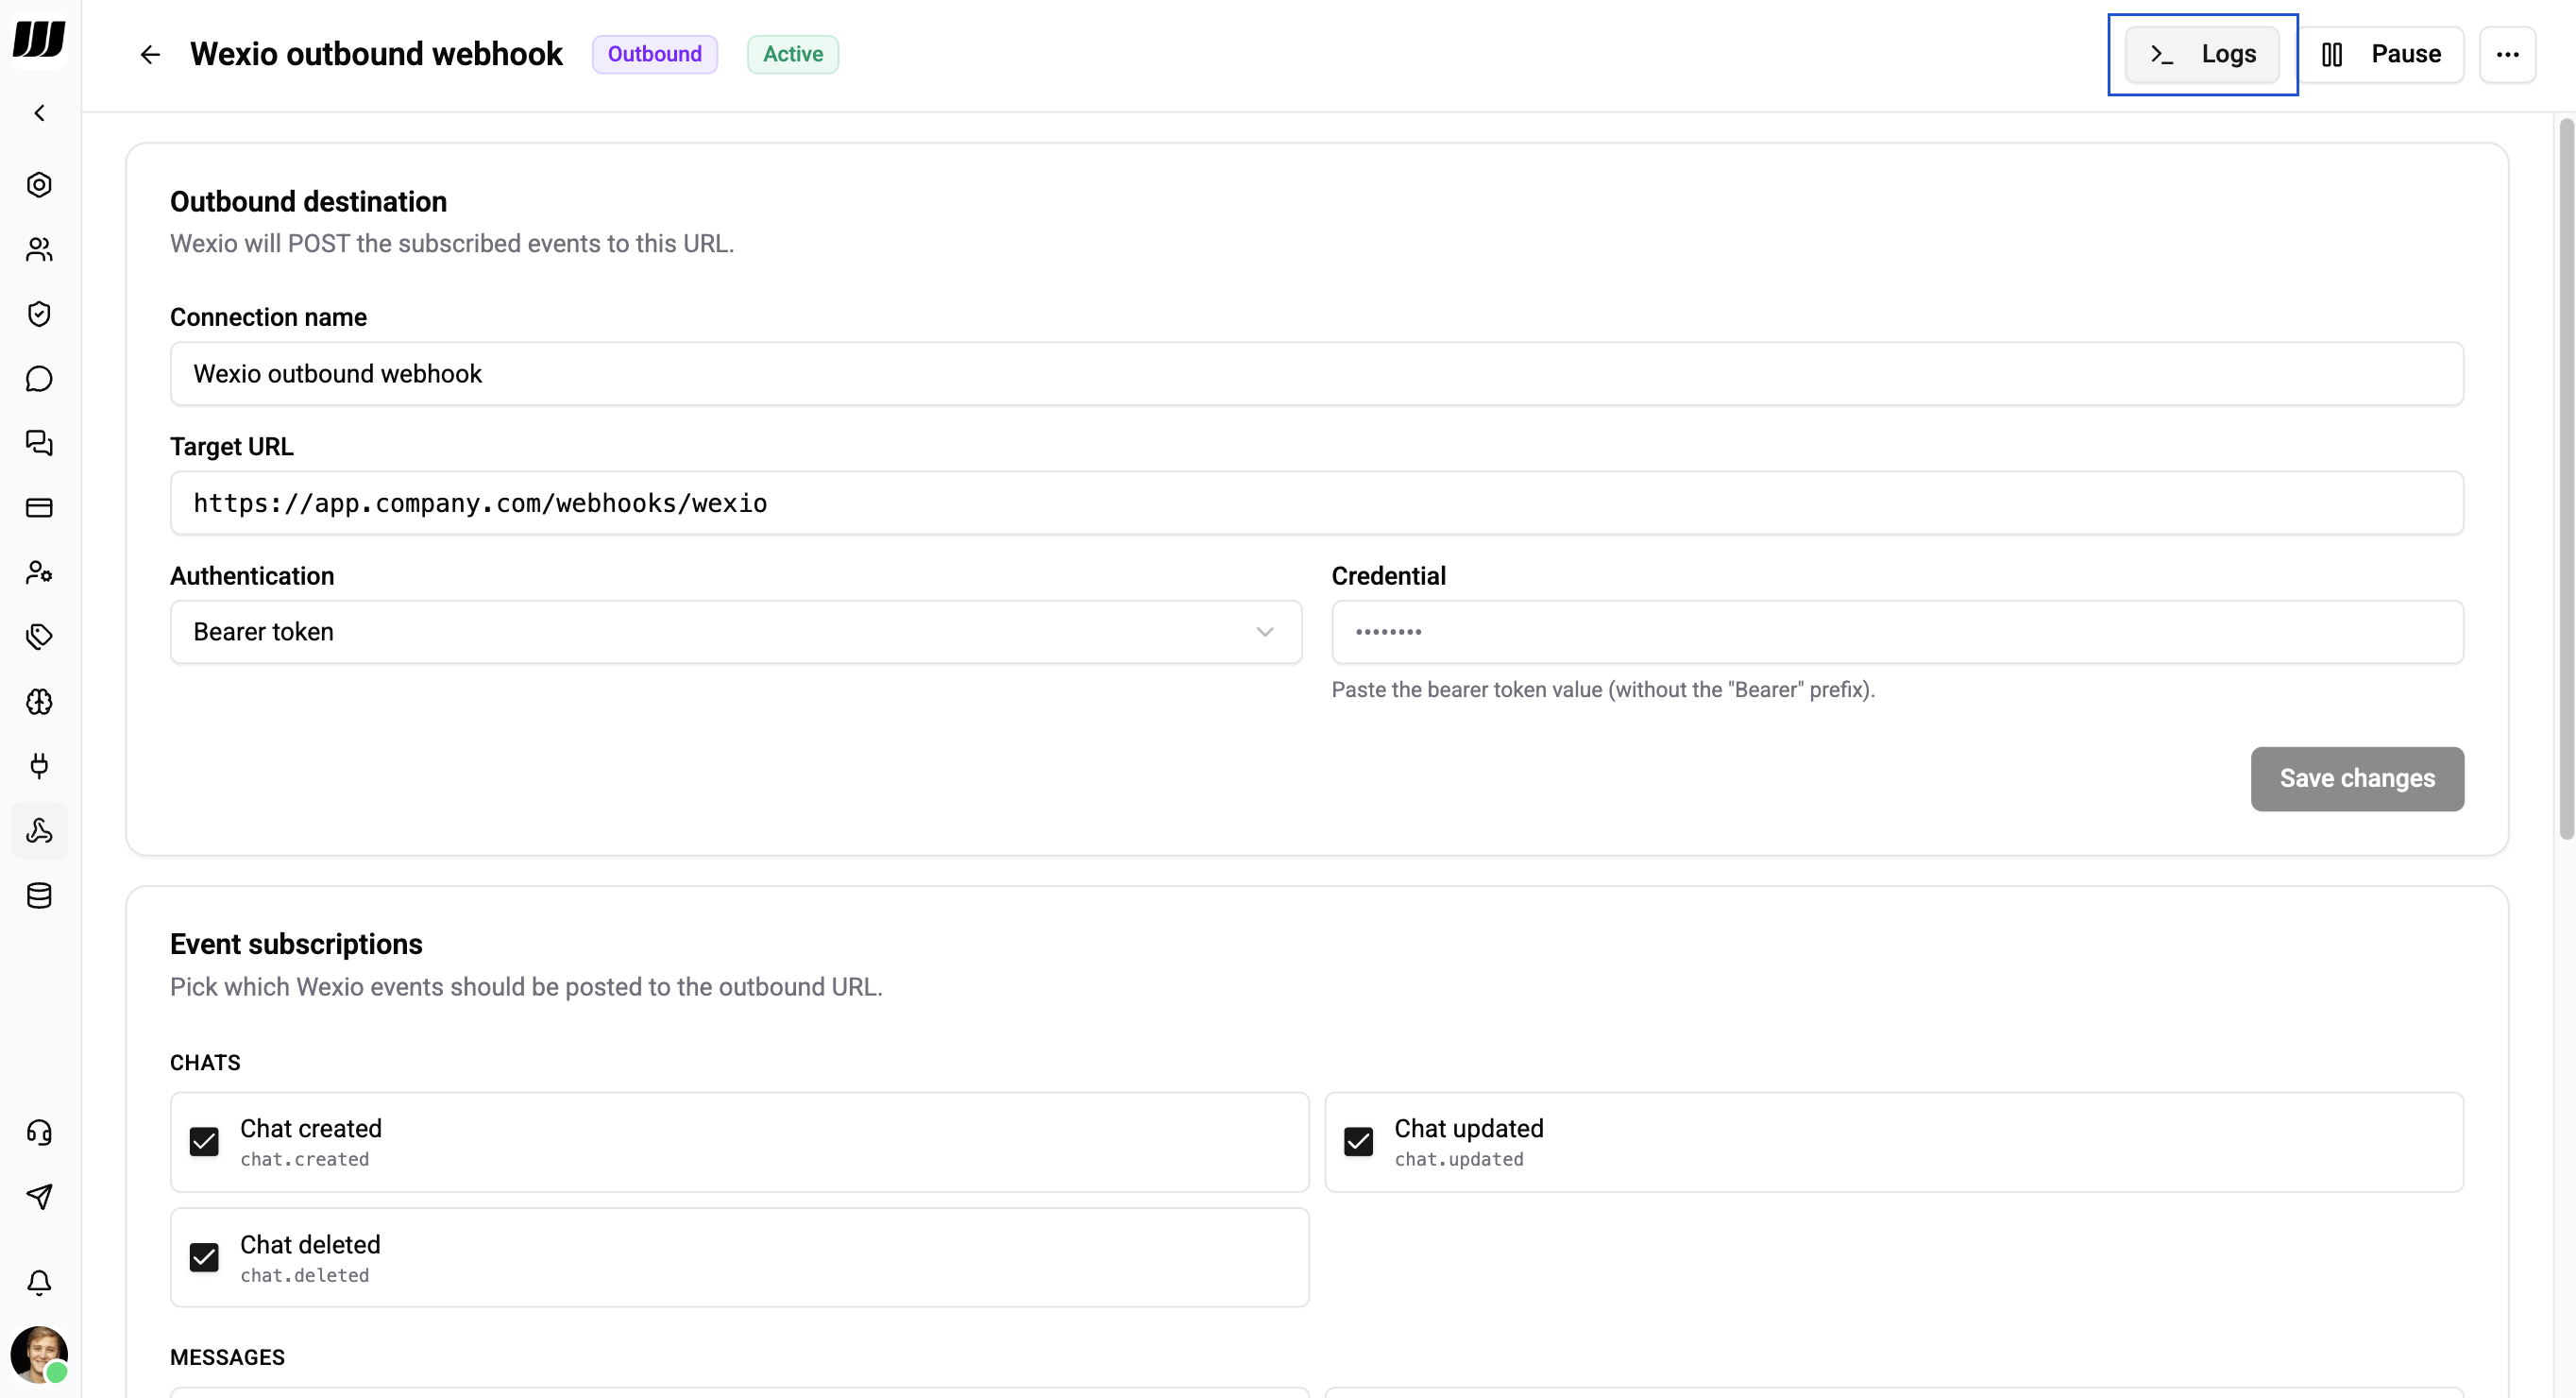
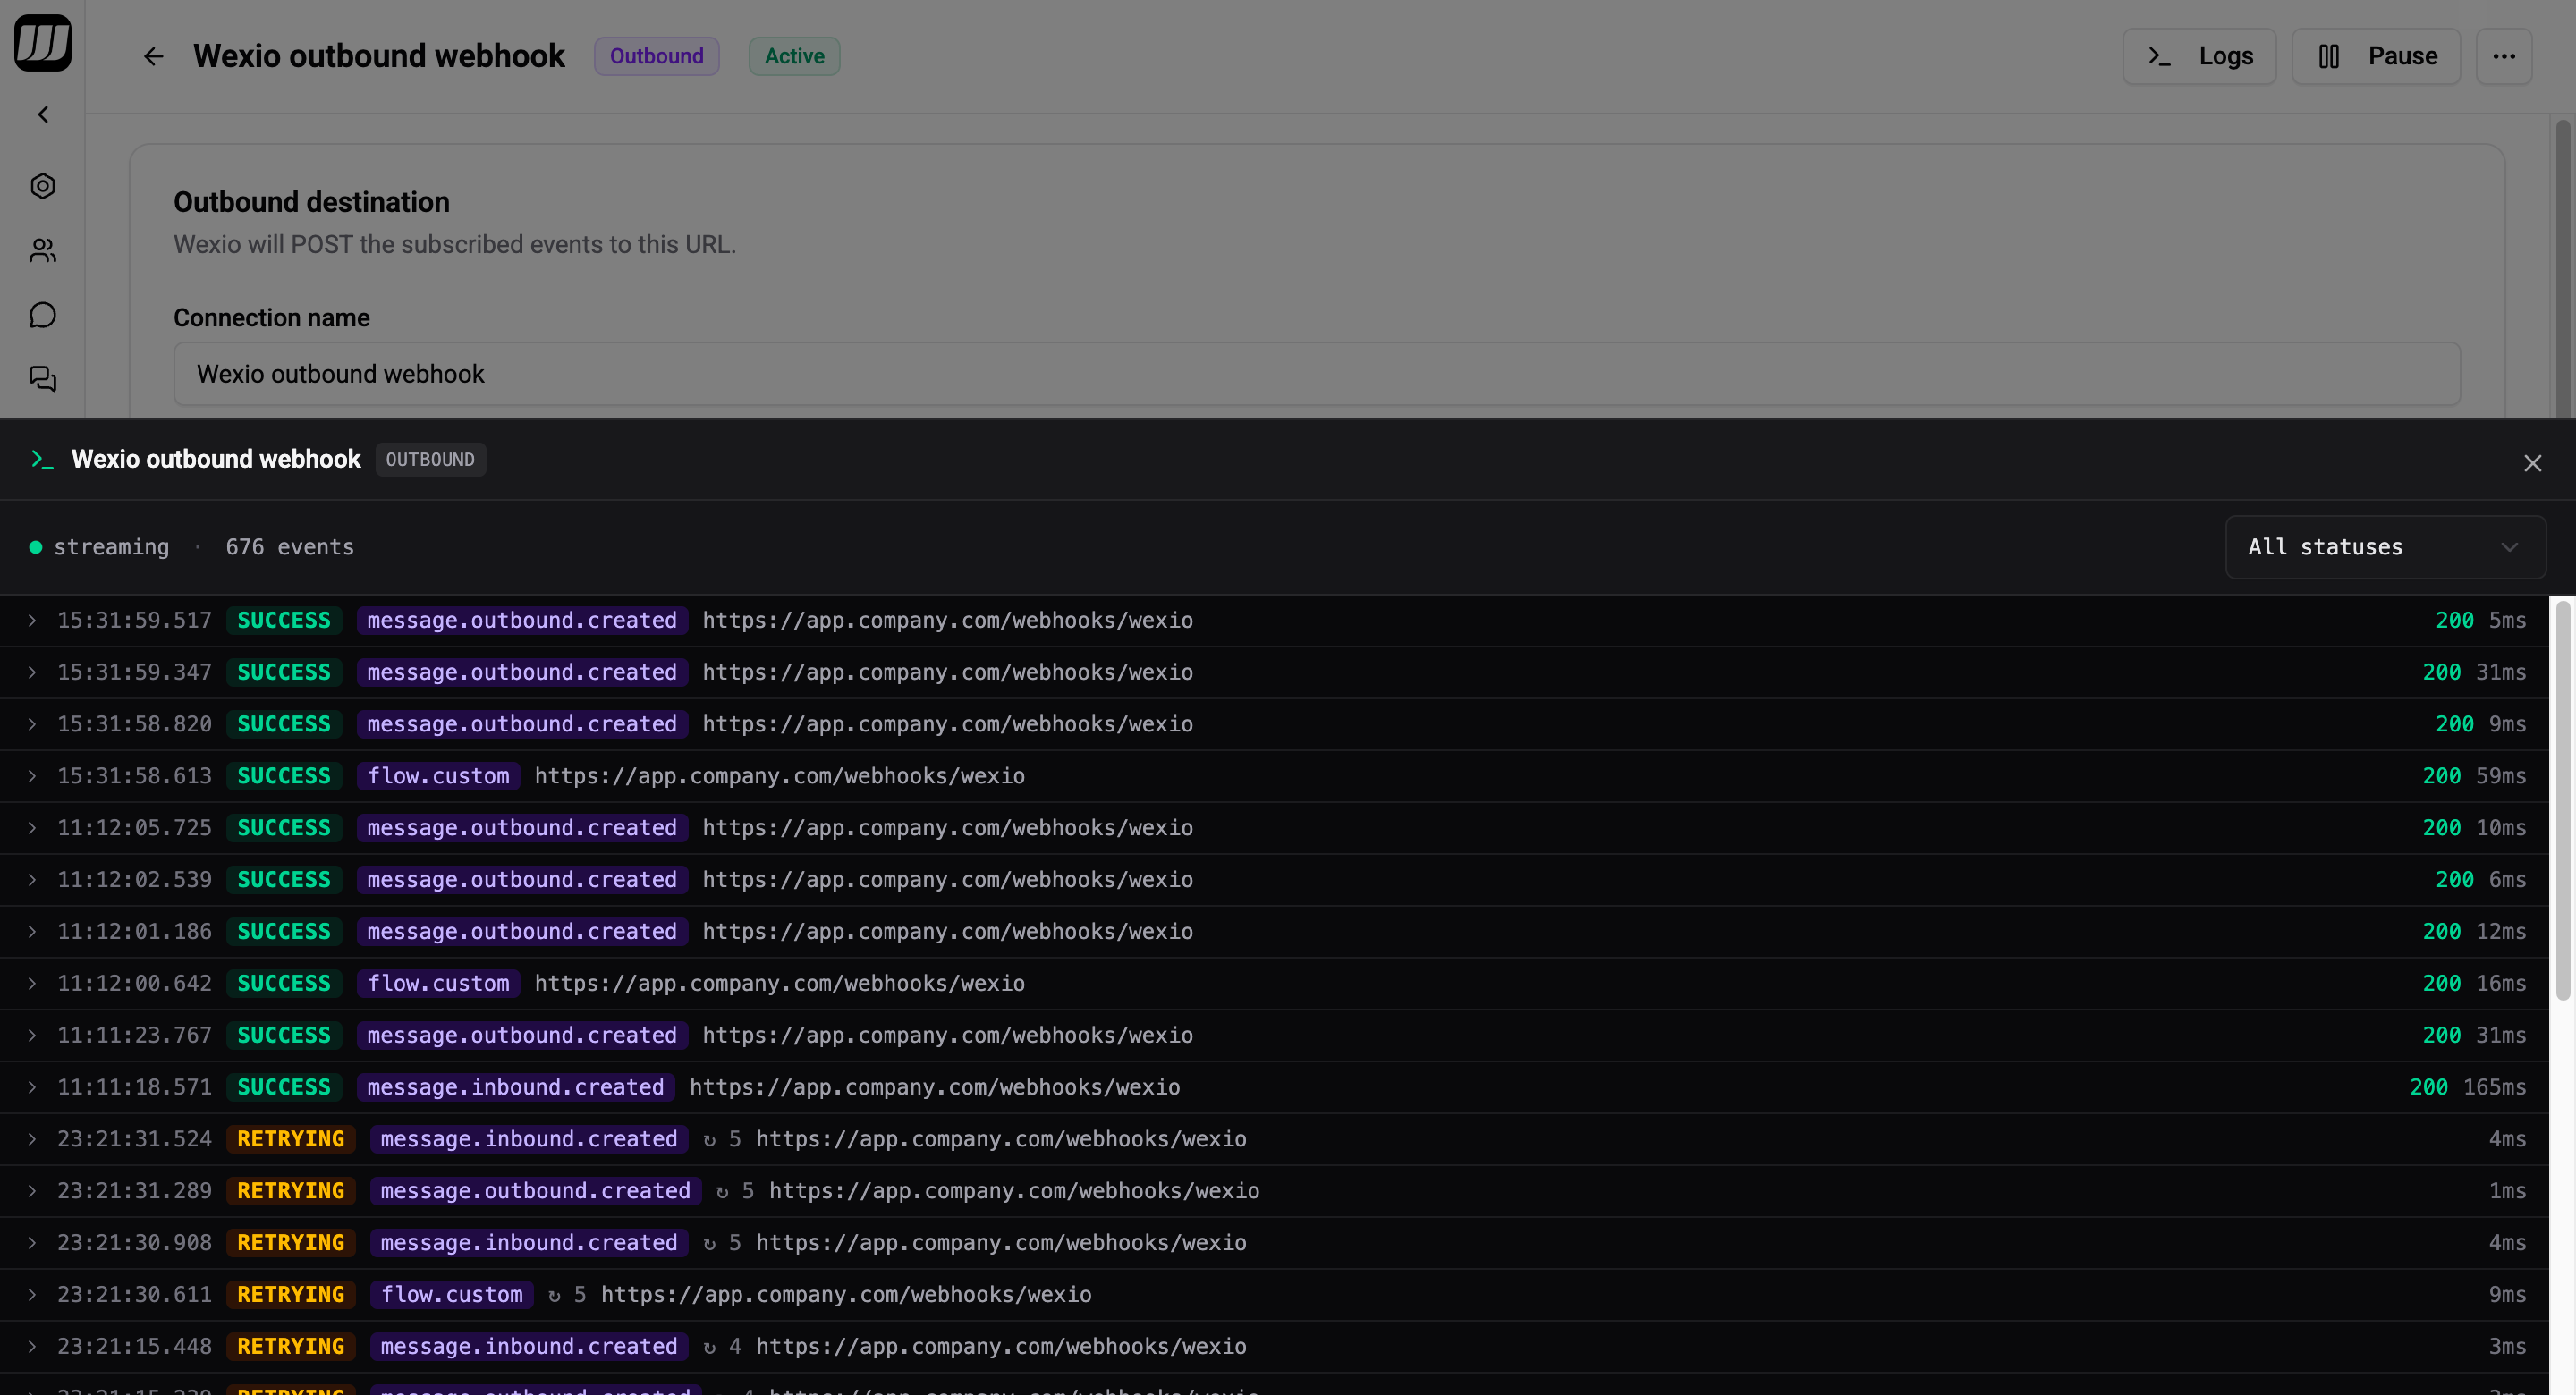
Browsing Outbound Deliveries
The Outbound subtab lists every delivery attempt Wexio sent to an external URL.
| Column | Meaning |
|---|---|
| Timestamp | When the attempt was made |
| Event name | e.g. chat.created, message.outbound.created, flow.order_confirmed |
| Status | PENDING, SUCCESS, RETRYING, FAILED, DEAD_LETTER |
| Attempt | Retry number (1-indexed) |
| HTTP status | Response from the subscriber |
| Duration | Round-trip time |
Expand a row to see:
destinationUrl- where Wexio POSTedpayload- full signed envelope senterrorMessage- axios error code + HTTP status + first bytes of the response body when delivery failed
A single event (unique eventId) produces one row per attempt - they're linked in the UI so you can follow a retry chain end-to-end.
Redaction
Wexio stores history rows in the tenant database and scrubs sensitive headers before persisting. You will never see these in the history panel:
x-webhook-secretauthorizationcookie- Signature headers -
Stripe-Signature,X-Hub-Signature-256,Paddle-Signature, etc.
The allowlist of headers that are persisted:
content-type,content-lengthuser-agentx-request-id,x-idempotency-keyx-forwarded-for,x-real-ip
Body content is stored verbatim up to the first 4 KB for preview. For audit purposes only - Wexio does not index or search bodies.
Retention
Both inbound and outbound logs have a 30-day TTL in MongoDB. Mongo purges expired rows automatically - once a row ages out, there's no way to recover it.
Deleting a connection does not proactively clear its history; rows expire naturally at 30 days. If you need immediate cleanup, open a support ticket.
Operational Notes
- Logging latency never slows webhooks. Writes are fire-and-forget - the HTTP response returns first, the log is persisted on the next tick, then the live-tail event is published.
- A logging failure is non-fatal. If the history write fails, the request is unaffected; a warning lands in server logs.
- Cross-process delivery. Both subscriptions (inbound-received, outbound-dispatched) use Redis pub/sub, so the live tail works whether Wexio is running on one node or dozens.
- Invalid connection IDs don't log. A POST to a nonexistent connection returns 404 and is not persisted (there's no tenancy to attribute it to). Those requests show up in server logs only.
Using the History to Self-Diagnose
| Symptom | Likely cause | Fix |
|---|---|---|
Stream of UNAUTHORIZED rows | Wrong signing secret, or the partner rotated theirs | Re-copy the signing secret into Wexio |
UNAUTHORIZED with "timestamp outside tolerance" | Clock skew on the partner, or an old Stripe replay | Check NTP on the sender |
IDENTIFIER_NOT_FOUND | Contact doesn't exist yet, or the JSON path is wrong | Verify the path in the connection config; capture a fresh schema if the payload changed |
INVALID_JSON | Partner is sending form-encoded bodies | Change the partner to send application/json |
Outbound FAILED clusters | Receiver is down / slow | Check their side; Wexio will retry with exponential backoff |